IRMA User Guide
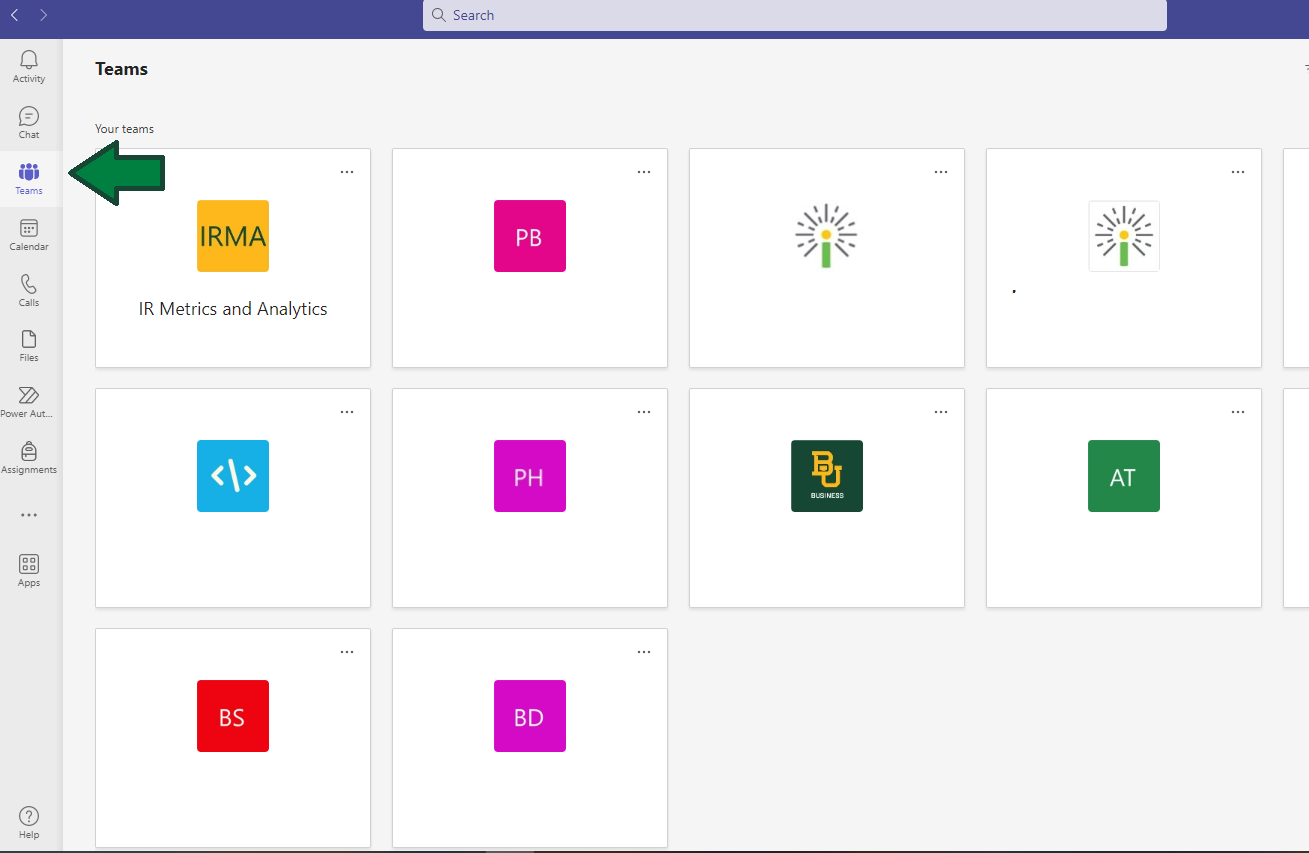
- In the Microsoft Teams application or website, navigate to Teams icon.
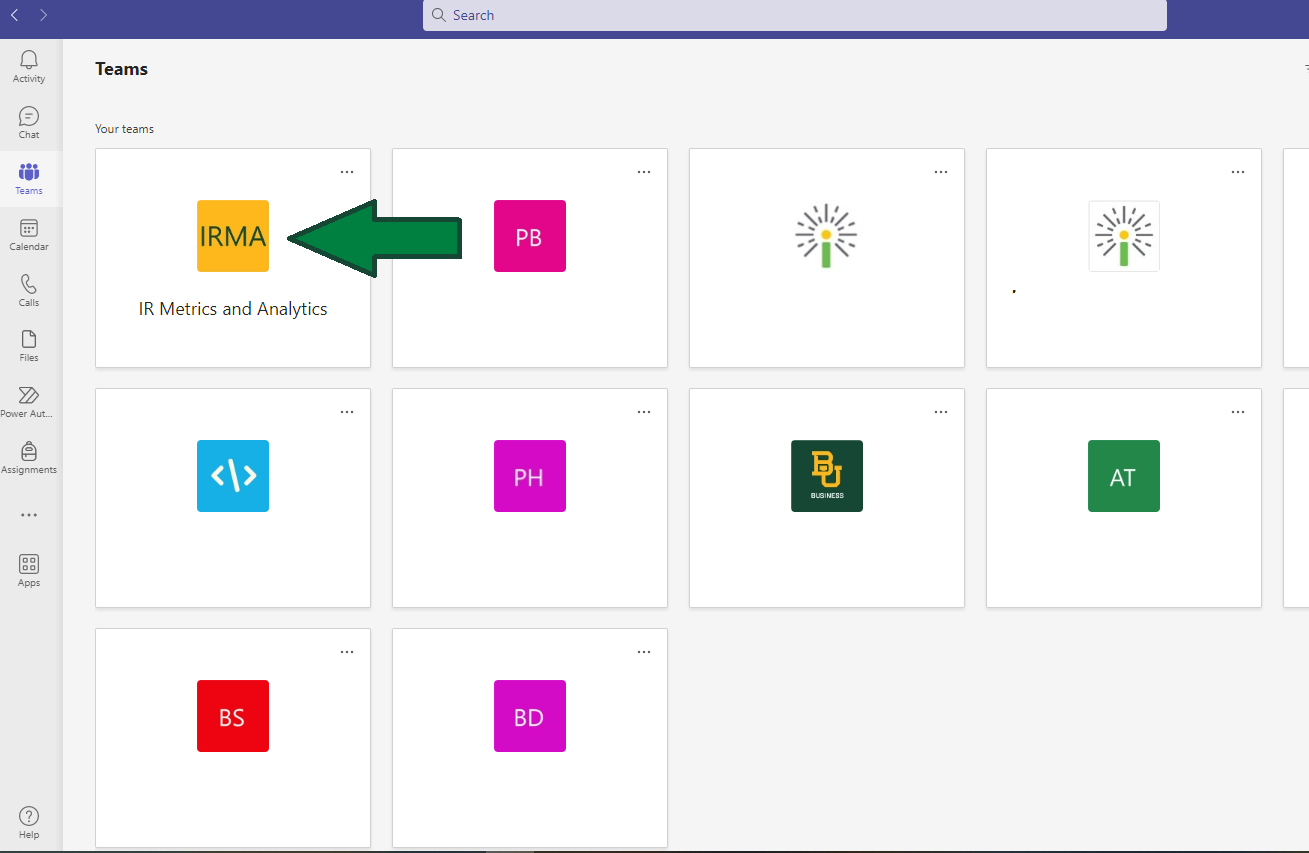
- Click on the team name that you wish to view.
2. Channel Selection
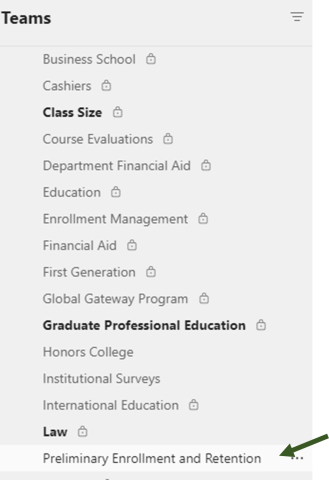
- Choose the Channel in which the report is located.
3. Report Selection
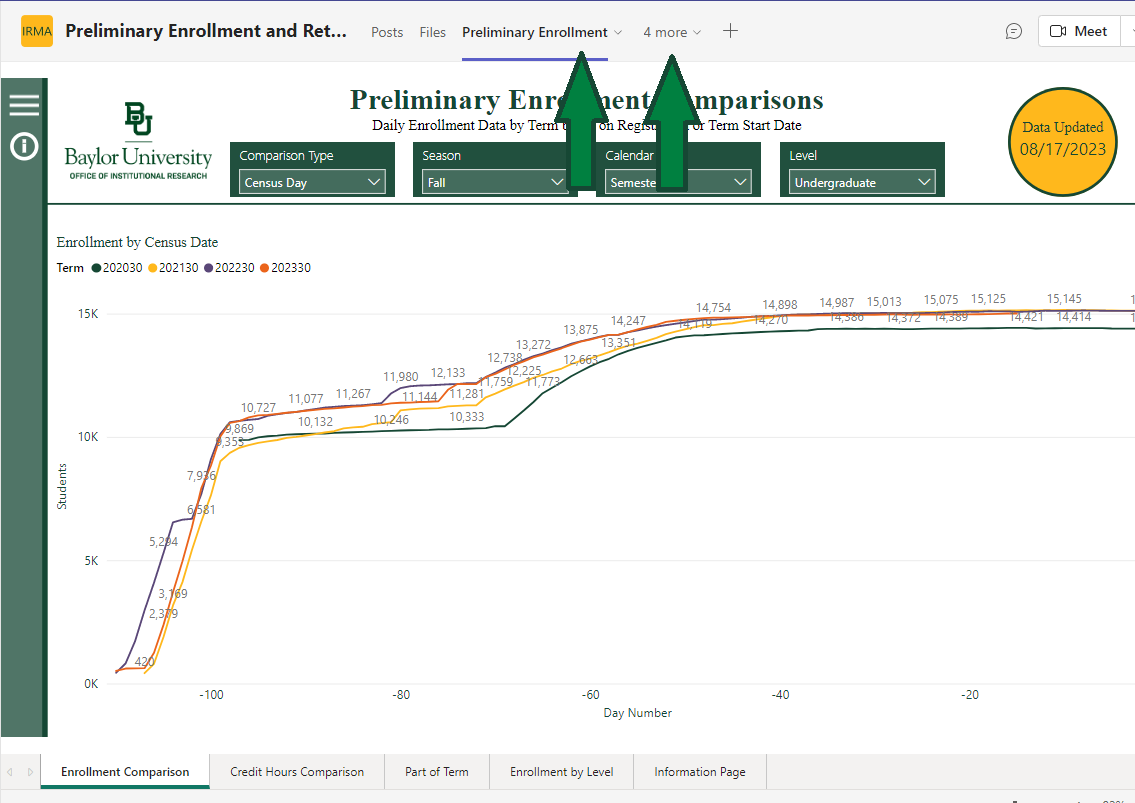
- To view a report, select an item from the top navigation panel (note, on some channels, you will need to click the “more” button to view additional reports)
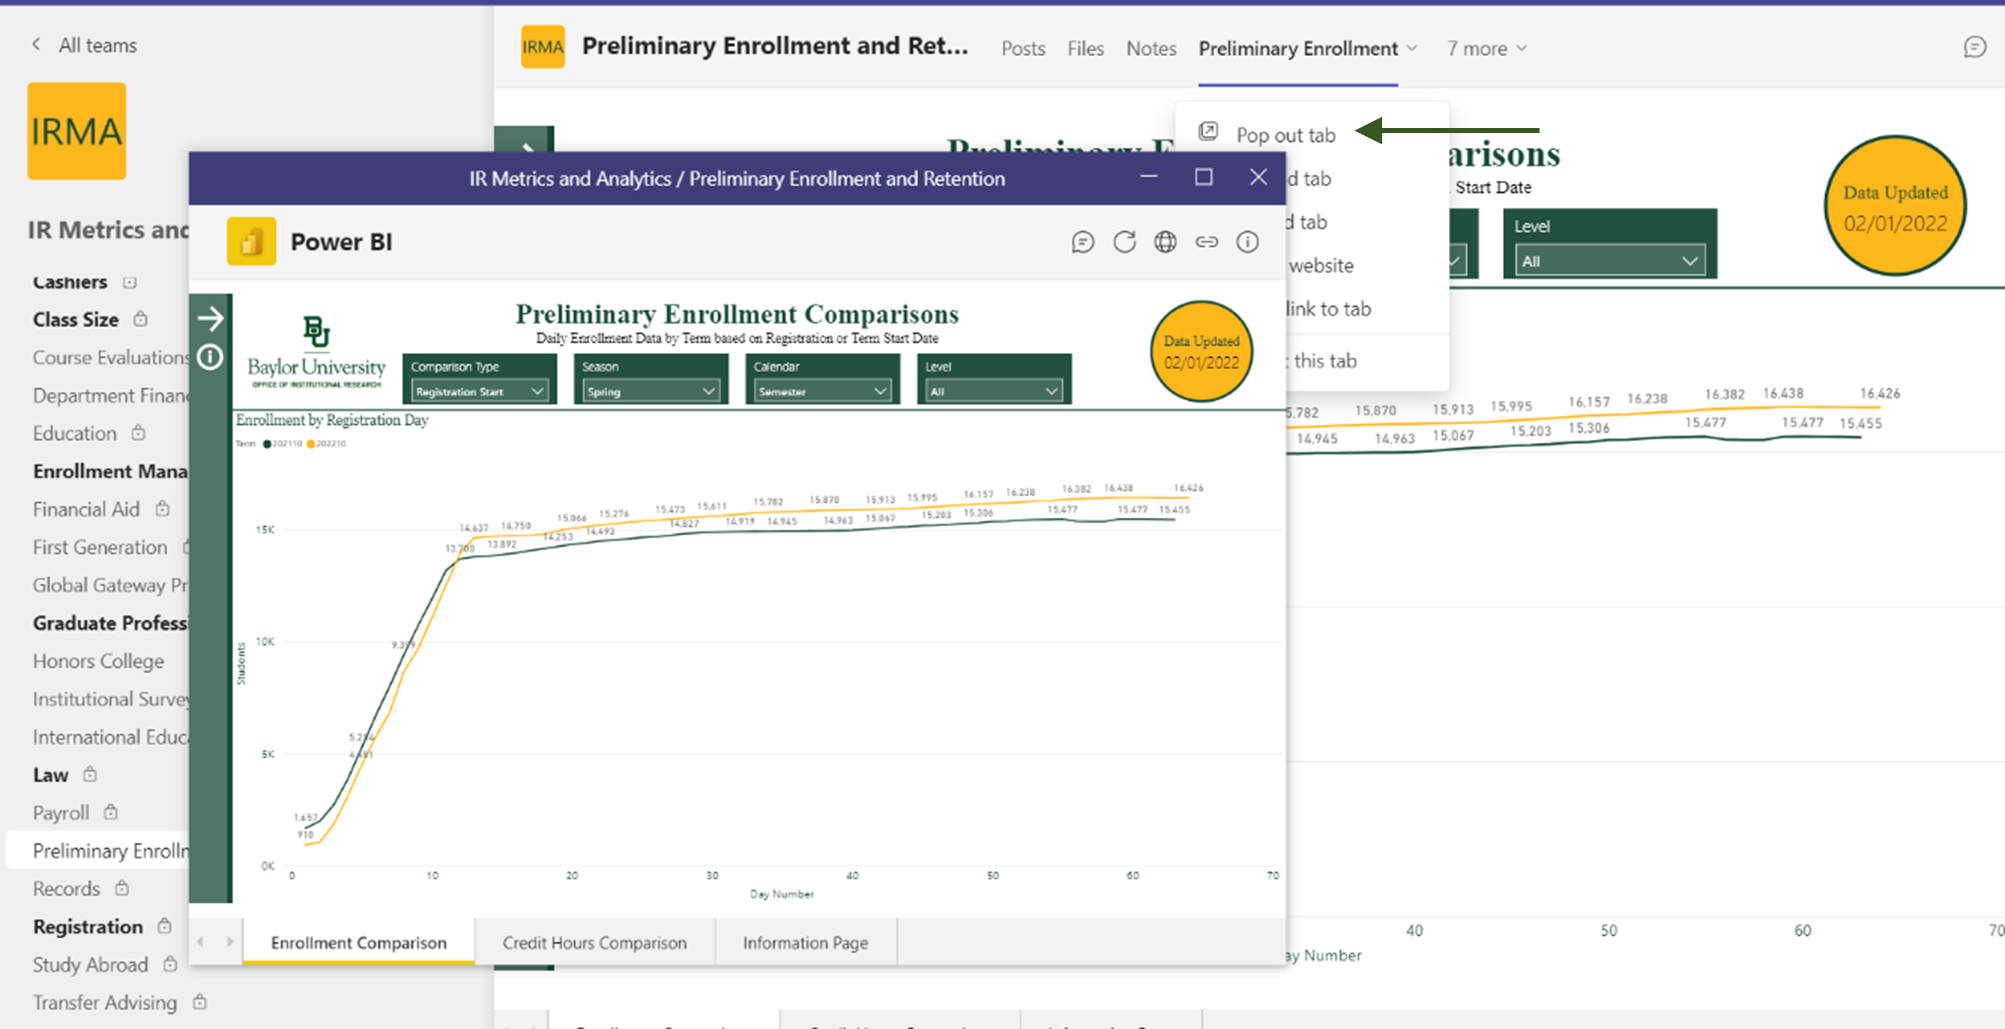
- If you’d like to pop out the report, select the “Pop Out Tab” button. This will open the report in a new window.
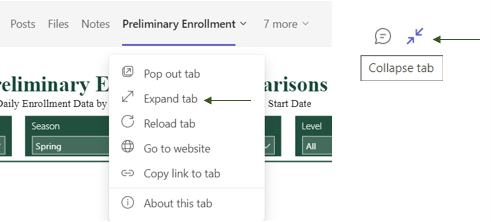
- If you want to expand the report, select the drop down next to the report name and click “expand tab”. Click again to collapse.
4. Slicers and Filter Panes in Power BI
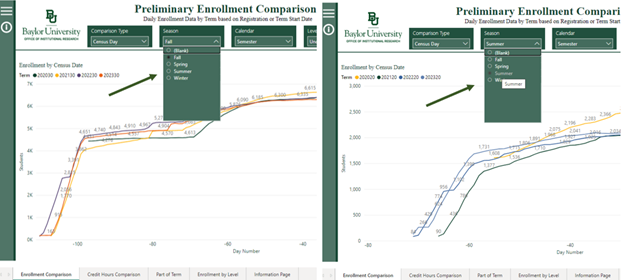
- Users can select items for inclusion from the filters on the side or top of reports. By selecting a different filter, the data in the chart will change. The radio buttons will stay selected until you either exit the report or the user manually switches them.
- Some reports also have category slicers across the report. Click on the category you want to see. Other slicers will stay selected as you move through the categories.

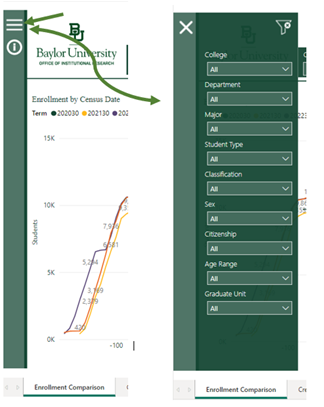
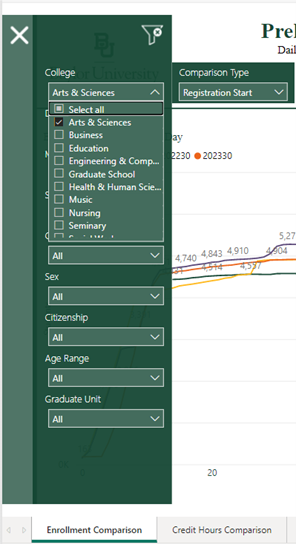
- For more filters, click the hamburger button on the left side pane. This will bring out a list of slicers and each filter is a different parameter of the data shown in the visualization.
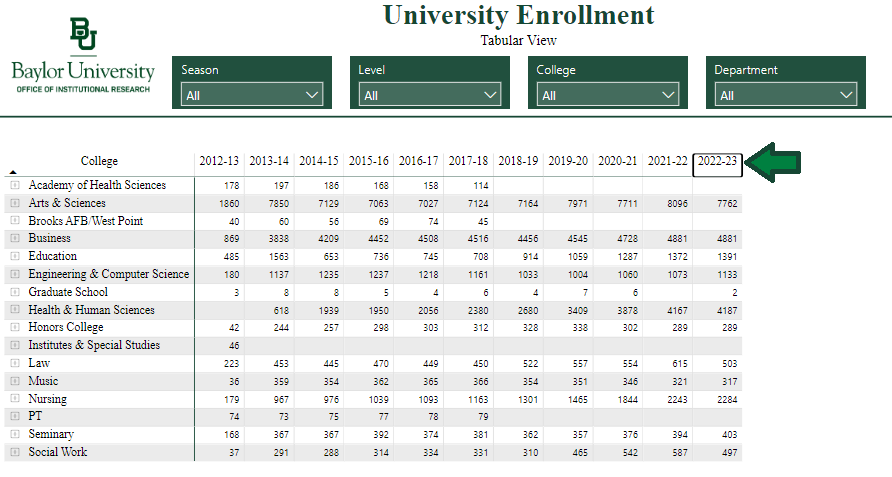
- As an example, clicking on the College slicer and selecting Arts & Sciences in the pop-out filter pane will automatically filter the visual on the page to show only data for the College of Arts & Sciences. To reset the filters, simply click on the clear filter button (appears as a filter with an x above the right-side slicer menu). This will revert the report back to its default data setting.
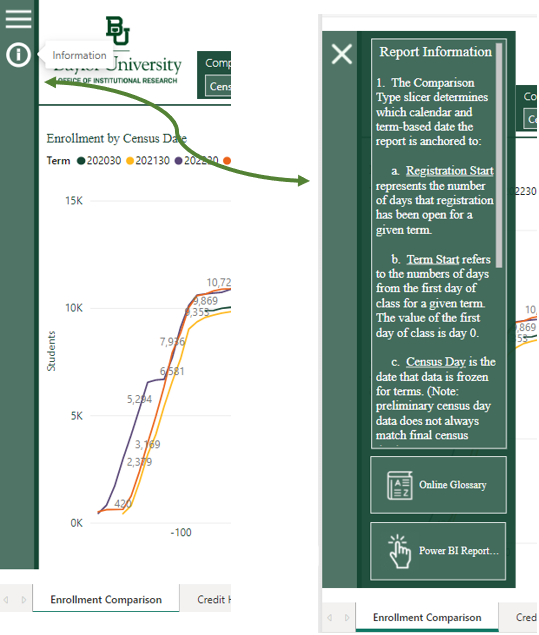
- The bar on the left-side of the screen also contains an information tab. To start, click the “i” icon. This section gives information about the report as well as linking to the glossary and user guide on the IR website. To access the glossary, click the book. To access the user’s guide, click the pointer button. These links will open a new window in your browser and will allow you to keep all filters and slicers set on the report you are currently viewing.
5. Interacting with Visuals in Power BI
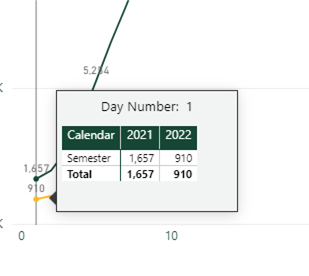
- Many reports contain additional information within the visual. To see additional information, hover the mouse over any bar, line, or chart.
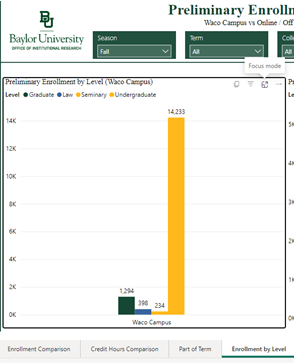
- Some visuals offer the option to view it larger in “focus mode”. To enable this feature, hover on the visual you would like to select. When the icons appear at the top, click to enable them. Then select the box labeled “focus mode”.
- To exit “focus mode”, click “Back to report”.
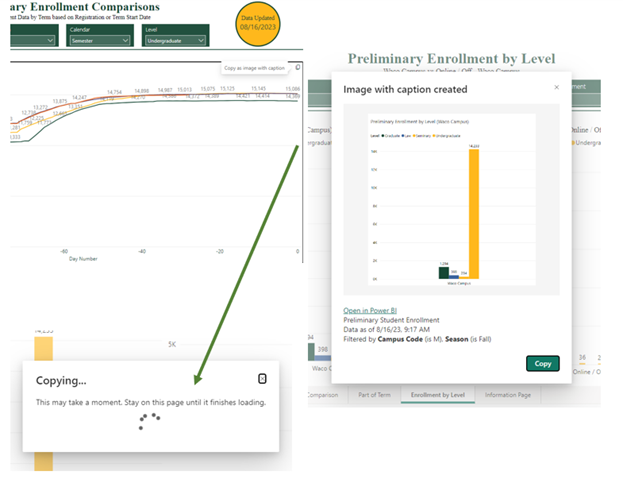
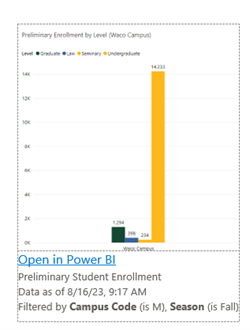
- Some reports also allow you to copy reports as images. To begin, select and hover on the visual you want to select, then find the copy icon and select it. A pop up will appear. If you navigate off the page in Teams before the image pops up, you will need to begin again. Once finished, you’ll see the box titled “Image with caption created”. Select copy and then you can use the image of the report.
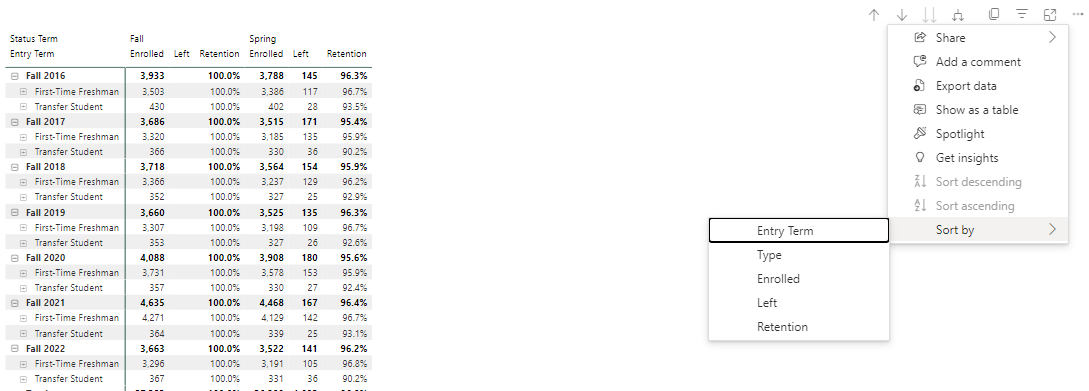
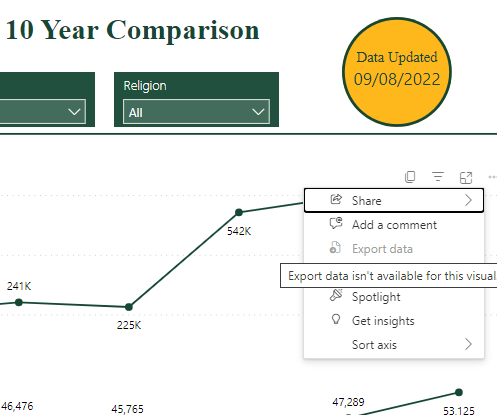
- Some reports allow you to sort the existing view differently or export data to Excel (note, not all reports will have data available for export).
6. Drill Down and Exporting Data in Power BI
- Please note: not all reports are available for drilling down to student level data and export.
- To start, select the report you wish to view.
- If your report has a Table tab, please follow the instructions below. If not, please keep scrolling.
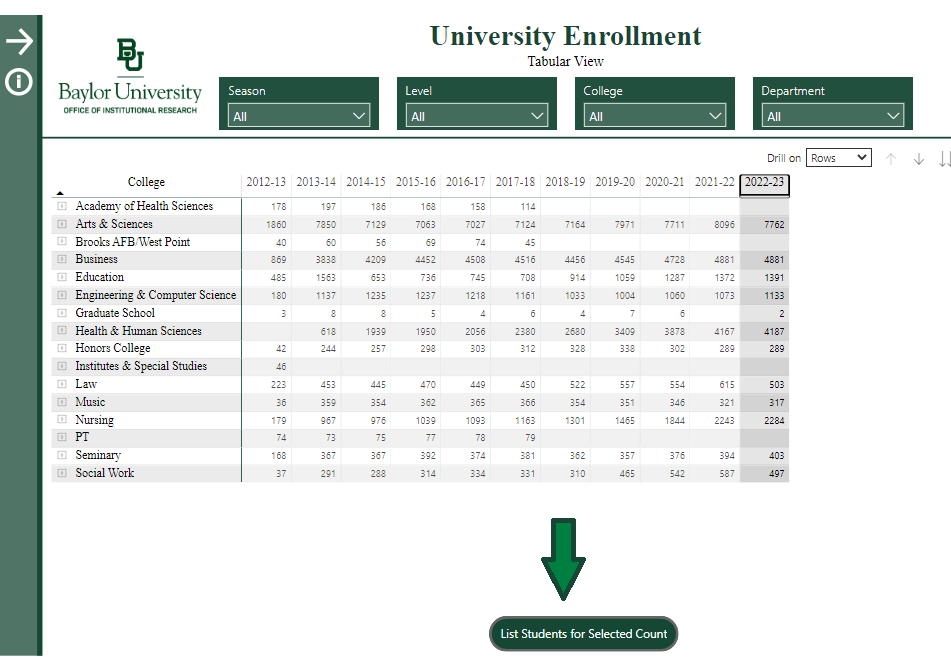
- Click the on the Table tab. Then, you will need to select a row, column, or cell to enable data export.
- After you select an item, the List Students for Selected Count button at the bottom of the page will activate.
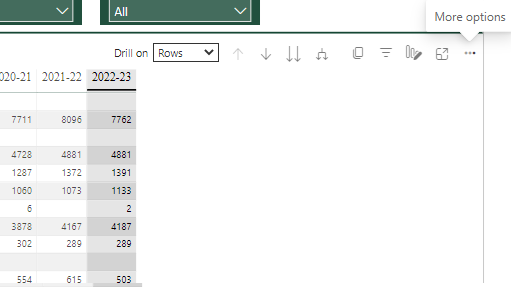
- To begin the export process, click the List Students for Selected Count button. If you hover your mouse over the three dots to the right-hand side of the screen, a more options menu will appear.
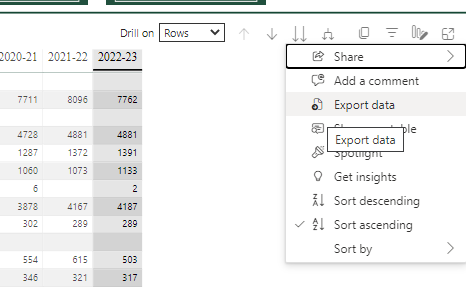
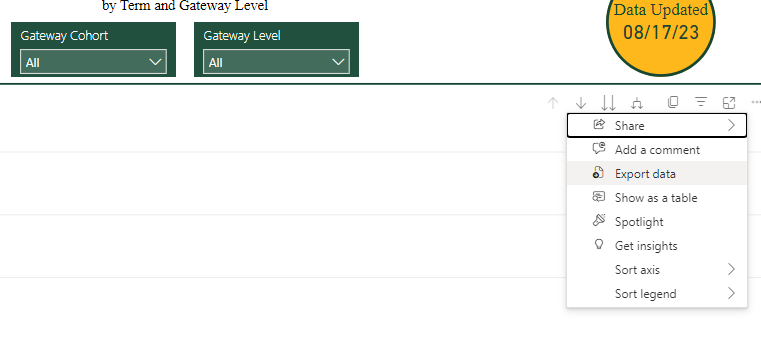
- Click the three dots and a menu will pop open.
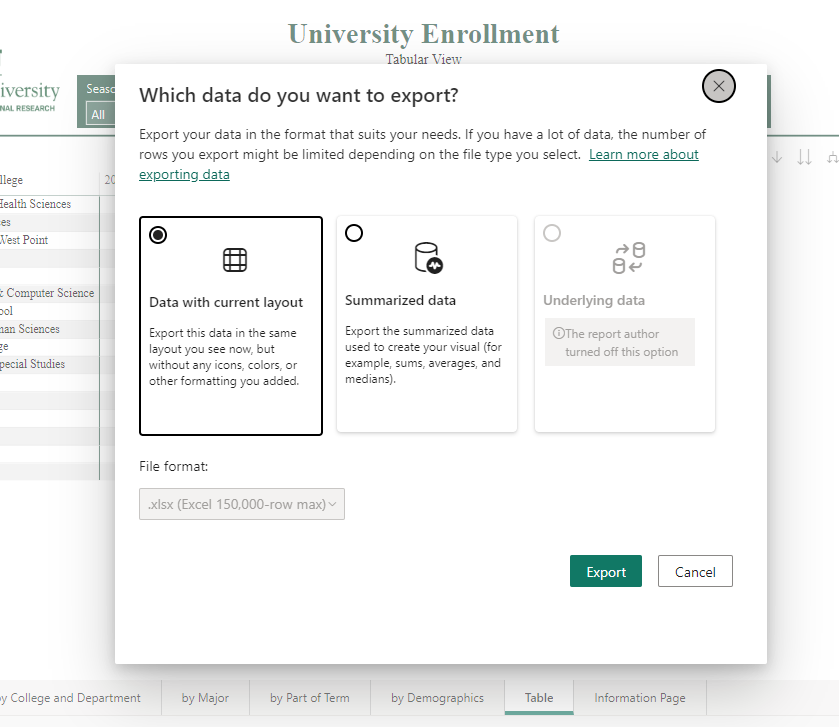
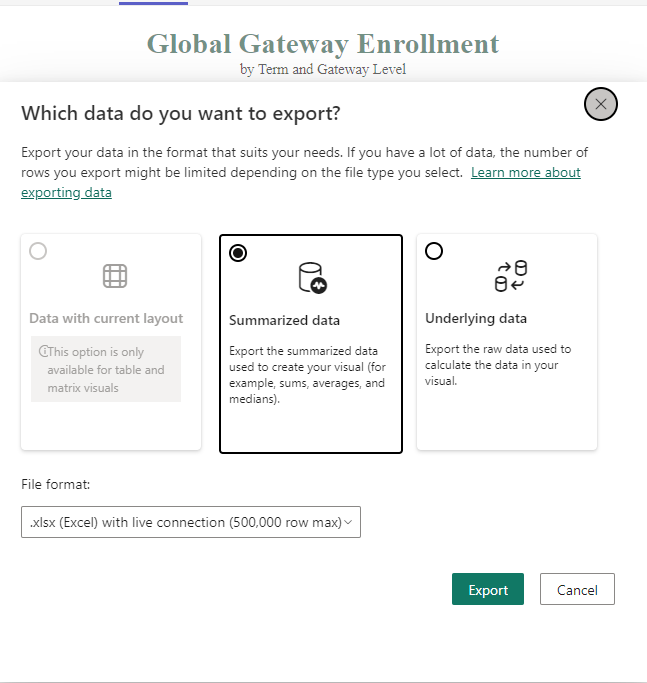
- After clicking on Export Data, the following menu will appear. Select the dataset you want and click export. (Reminder that all information downloaded is subject to FERPA policies and the guidelines outlined in the Baylor Handling of Confidential Information Policy: BU-PP 029.) Exported data will appear in your download folder.
- If your report does not have Table tab please follow the instructions below. (Note- not all reports have the option to export data.) To begin the export, click on the three dots to the right of the screen.
- After clicking on Export Data, the following menu will appear. Select the dataset you want and click export. The file will appear as an Excel document. Note: Not all options are available for every report.
(Reminder that all information downloaded is subject to FERPA policies and the guidelines outlined in the Baylor Handling of Confidential Information Policy: BU-PP 029.)
- Additionally, not all reports will not have an option to export any data.
For additional support, comments, or questions contact ir@baylor.edu
